Blog

Archive for the ‘mapping’ category: Page 2

Sep 11, 2024

Combining the power of AI and the connectome to predict brain cell activity

Posted by in categories: mapping, robotics/AI

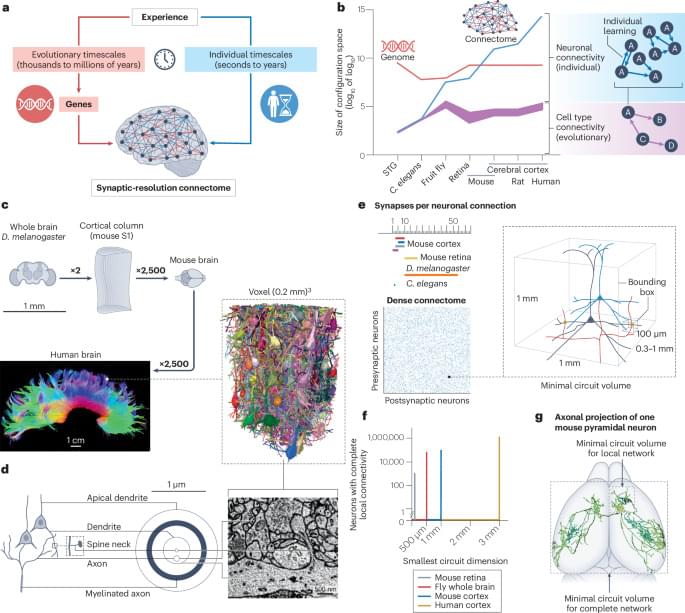
With maps of the connections between neurons and artificial intelligence methods, researchers can now do what they never thought possible: predict the activity of individual neurons without making a single measurement in a living brain.

For decades, neuroscientists have spent countless hours in the lab painstakingly measuring the activity of neurons in living animals to tease out how the brain enables behavior. These experiments have yielded groundbreaking insights into how the brain works, but they have only scratched the surface, leaving much of the brain unexplored.

Now, researchers are using artificial intelligence and the connectome—a map of neurons and their connections created from —to predict the role of neurons in the living brain. Their paper has been published in the journal Nature.

Sep 6, 2024

Treating Epidemics as Feedback Loops

Posted by in categories: biotech/medical, engineering, mapping, mathematics

During the worst days of the COVID-19 pandemic, many of us became accustomed to news reports on the reproduction number R, which is the average number of cases arising from a single infected case. If we were told that R was much greater than 1, that meant the number of infections was growing rapidly, and interventions (such as social distancing and lockdowns) were necessary. But if R was near to 1, then the disease was deemed to be under control and some relaxation of restrictions could be warranted. New mathematical modeling by Kris Parag from Imperial College London shows limitations to using R or a related growth rate parameter for assessing the “controllability” of an epidemic [1]. As an alternative strategy, Parag suggests a framework based on treating an epidemic as a positive feedback loop. The model produces two new controllability parameters that describe how far a disease outbreak is from a stable condition, which is one with feedback that doesn’t lead to growth.

Parag’s starting point is the classical mathematical description of how an epidemic evolves in time in terms of the reproduction number R. This approach is called the renewal model and has been widely used for infectious diseases such as COVID-19, SARS, influenza, Ebola, and measles. In this model, new infections are determined by past infections through a mathematical function called the generation-time distribution, which describes how long it takes for someone to infect someone else. Parag departs from this traditional approach by using a kind of Fourier transform, called a Laplace transform, to convert the generation-time distribution into periodic functions that define the number of the infections. The Laplace transform is commonly adopted in control theory, a field of engineering that deals with the control of machines and other dynamical systems by treating them as feedback loops.

The first outcome of applying the Laplace transform to epidemic systems is that it defines a so-called transfer function that maps input cases (such as infected travelers) onto output infections by means of a closed feedback loop. Control measures (such as quarantines and mask requirements) aim to disrupt this loop by acting as a kind of “friction” force. The framework yields two new parameters that naturally describe the controllability of the system: the gain margin and the delay margin. The gain margin quantifies how much infections must be scaled by interventions to stabilize the epidemic (where stability is defined by R = 1). The delay margin is related to how long one can wait to implement an intervention. If, for example, the gain margin is 2 and the delay margin is 7 days, then the epidemic is stable provided that the number of infections doesn’t double and that control measures are applied within a week.

Sep 3, 2024

How the next ‘supercontinent’ will form

Posted by in category: mapping

Year 2022 face_with_colon_three


It might seem that the world’s landmasses are fixed, but as Richard Fisher discovers, there are major changes coming.

Nearly 500 years ago, the Flemish cartographer Geradus Mercator produced one of the world’s most important maps.

Continue reading “How the next ‘supercontinent’ will form” »

Sep 1, 2024

3 supermassive black holes — each weighing more than 90 million Suns located in a single galaxy

Posted by in categories: cosmology, mapping, physics

In the study, an international team of astronomers identified three supermassive black holes lurking near the center of galaxy NGC 6,240, which has been visibly disturbed by the gravitational effects of a triple merger. Because NGC 6,240 is so close—just 300 million light-years away—astronomers had previously assumed that its odd shape was the product of a typical merger between two galaxies. They believed that these two galaxies collided as they increased to hundreds of miles per second, and that they are still combining. Therefore, the researchers expected to find two supermassive black holes hiding near the center of the cosmic collision.

Instead, the team discovered three supermassive black holes, each weighing more than 90 million Suns, when they used 3D mapping techniques to peer into the core of NGC 6240. (To put this into perspective, Sagittarius A*, the supermassive black hole at the center of the Milky Way, is roughly 4 million solar masses in weight.) Furthermore, the three massive black holes of NGC 6,240 are confined to an area that is less than 3,000 light-years across, or less than 1% of the galaxy in which they are found.

“Up until now, such a concentration of three supermassive black holes had never been discovered in the universe,” said study co-author Peter Weilbacher of the Leibniz Institute for Astrophysics Potsdam in a press release. This is the first time that scientists have seen a group of supermassive black holes packed into such a small area, despite the fact that they have previously discovered three distinct galaxies and the black holes that are connected to them on a collision course.

Aug 17, 2024

Mapping the Textures of Thicker Magnets

Posted by in categories: mapping, materials

A soft x-ray magnetic imaging technique makes possible the study of a wide range of magnetic materials.

Aug 2, 2024

Mapping AI’s Rapid Advance

Posted by in categories: mapping, robotics/AI

Former Google CEO Eric Schmidt weighs in on where AI is headed, when to “pull the plug” and how to cope with China.

Jul 30, 2024

Most cyber ransoms are paid in secret but a new law could change that

Posted by in categories: business, cybercrime/malcode, government, law, mapping

Australian businesses are paying untold amounts of ransom to hackers, but the government is hoping to claw back some visibility with a landmark cybersecurity law.

While major ransomware attacks on companies such as MediSecure, Optus and Latitude have grabbed headlines for breaching the privacy of millions, the practice of quietly paying off cybercriminals has flourished in the dark.

The situation has deteriorated to the point that the government’s original ambition for an outright ban on ransom payments has been nixed, for now, and the focus has shifted to mapping the scale of the problem.

Jul 29, 2024

Dark matter seen through forest: Study examines matter distribution and supports unknown influence or new particle

Posted by in categories: cosmology, mapping, particle physics

The dense peaks in the wavelength distribution graph observed in a Lyman-Alpha forest indeed resemble many small trees. Each of those peaks represents a sudden drop in “light” at a specific and narrow wavelength, effectively mapping the matter that light has encountered on its journey to us.

Jul 29, 2024

Mapping the Mechanisms of Aging

Posted by in categories: biological, genetics, life extension, mapping, neuroscience

Aging is a universal experience, evident through changes like wrinkles and graying hair. However, aging goes beyond the surface; it begins within our cells. Over time, our cells gradually lose their ability to perform essential functions, leading to a decline that affects every part of our bodies, from our cognitive abilities to our immune health.

To understand how cellular changes lead to age-related disorders, Calico scientists are using advanced RNA sequencing to map molecular changes in individual cells over time in the roundworm, C. elegans. Much like mapping networks of roads and landscapes, we’re charting the complexities of our biology. These atlases uncover cell characteristics, functions, and interactions, providing deeper insights into how our bodies age.

In the early 1990s, Cynthia Kenyon, Vice President of Aging Research at Calico, and her former team at UCSF discovered genes in C. elegans that control lifespan; these genes, which influence IGF1 signaling, function similarly to extend lifespan in many other organisms, including mammals. The genetic similarities between this tiny worm and more complex animals make it a useful model for studying the aging process. In work published in Cell Reports last year, our researchers created a detailed map of gene activity in every cell of the body of C. elegans throughout its development, providing a comprehensive blueprint of its cellular diversity and functions. They found that aging is an organized process, not merely random deterioration. Each cell type follows its own aging path, with many activating cell-specific protective gene expression pathways, and with some cell types aging faster than others. Even within the same cell type, the rate of aging can vary.

Jul 29, 2024

How AI is fixing traffic lights | Project Green Light

Posted by in categories: mapping, robotics/AI, transportation

We’re using AI and Google Maps driving trends to optimize traffic light patterns and improve traffic flow. Stop-and-go traffic in urban areas causes 29 times more emissions than on open roads. Researchers at Google are partnering with cities around the globe, from Rio to Jakarta. So far, local governments have saved fuel and lowered emissions for nearly 30 million car rides every month. Learn more about this research at: https://g.co/research/greenlight.

If you are a city representative or traffic engineer and are interested in joining the waiting list, please complete this form: https://docs.google.com/forms/d/e/1FA

Continue reading “How AI is fixing traffic lights | Project Green Light” »

Page 2 of 5312345678Last