A new study from researchers at The University of Texas MD Anderson Cancer Center has uncovered how one of the most common genetic alterations in glioma rewires the cancer cell genome to fuel tumor progression, suggesting a potential new therapeutic strategy for patients with ATRX-mutant gliomas.
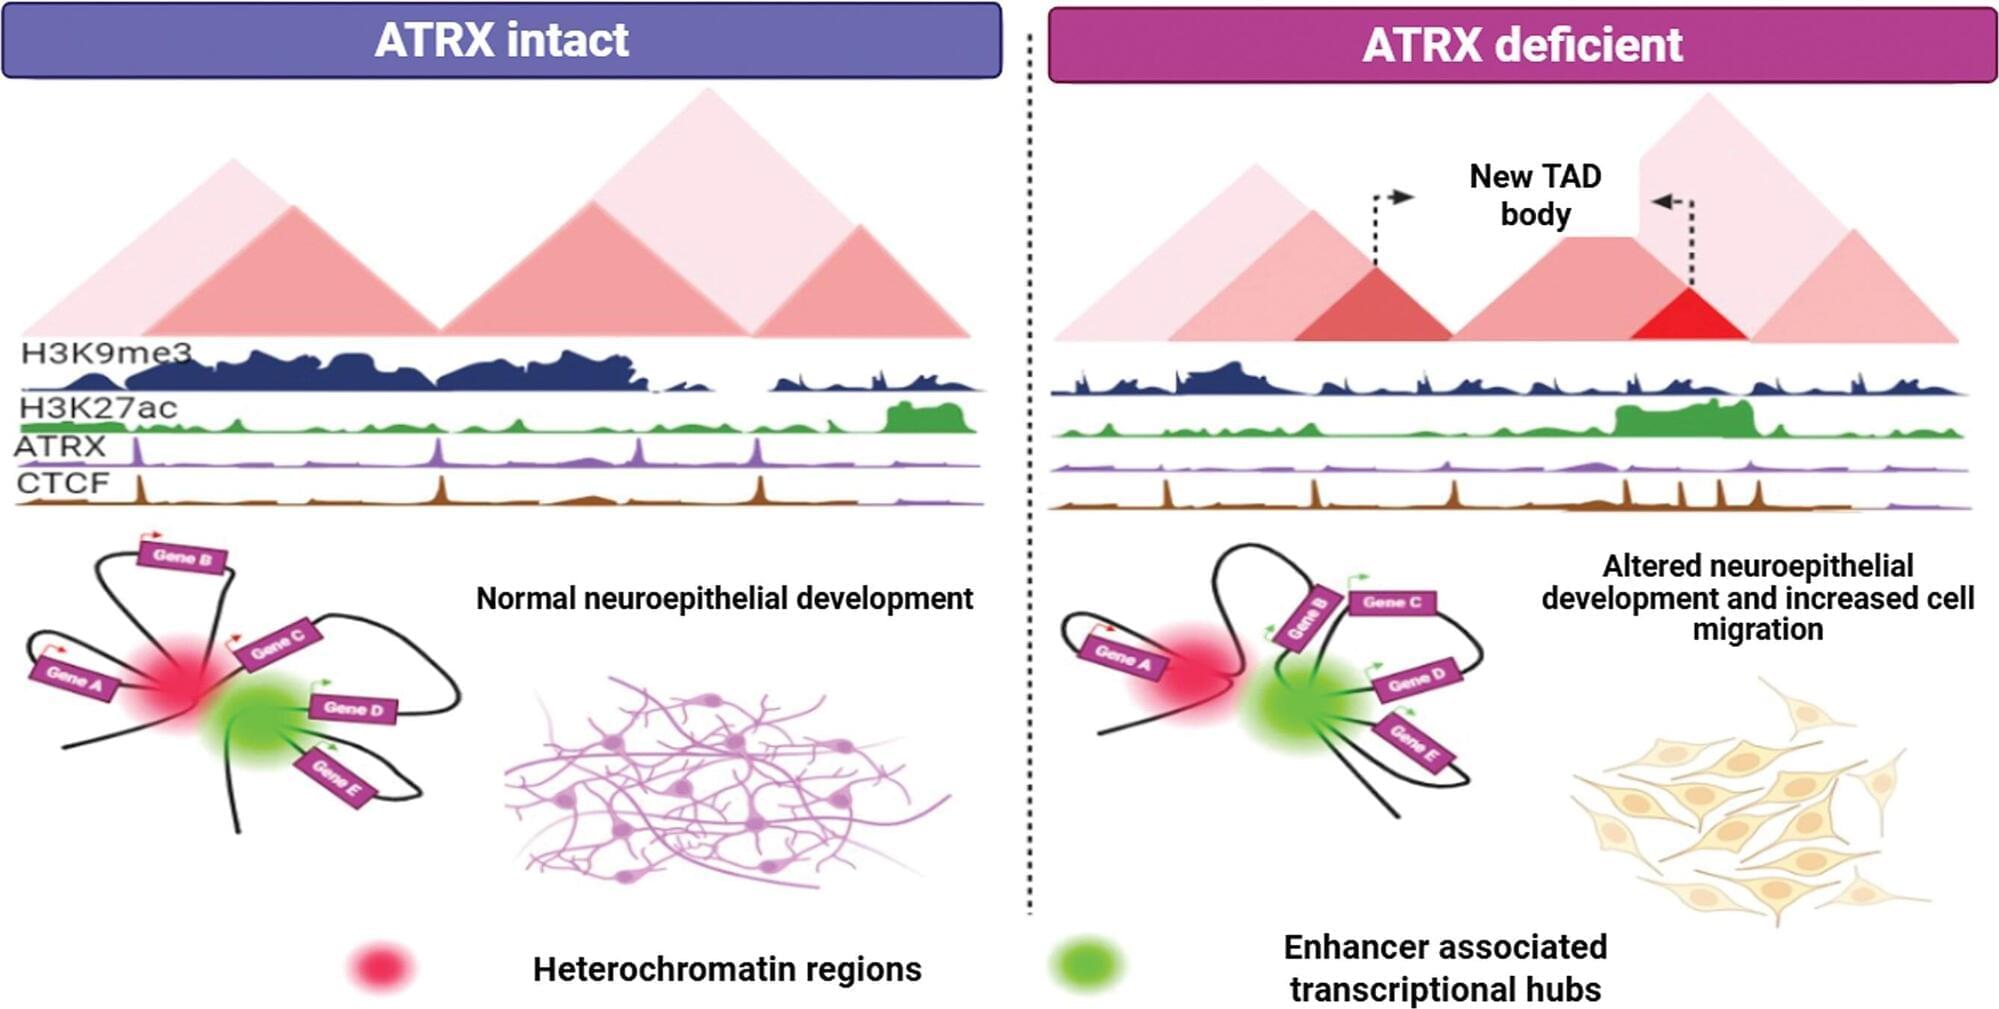
The findings show that mutations in the ATRX gene fundamentally reprogram the epigenome and change the three-dimensional structure of chromatin, creating new interactions that activate developmental programs that tumors exploit to grow and spread. Targeting one of the genes downstream of ATRX in preclinical models—particularly in the HOXA family—slowed cancer progression.
The study, published in Nucleic Acids Research, was co-led by Jason Huse, M.D., Ph.D., professor of Anatomic Pathology, and Kunal Rai, Ph.D., professor of Genomic Medicine, with major contributions from Prit Benny Malgulwar, Ph.D., instructor of Translational Molecular Pathology, Anand Singh, Ph.D., senior research scientist in Genomic Medicine, and Ajay Saw, Ph.D., previous postdoctoral fellow in Genomic Medicine.