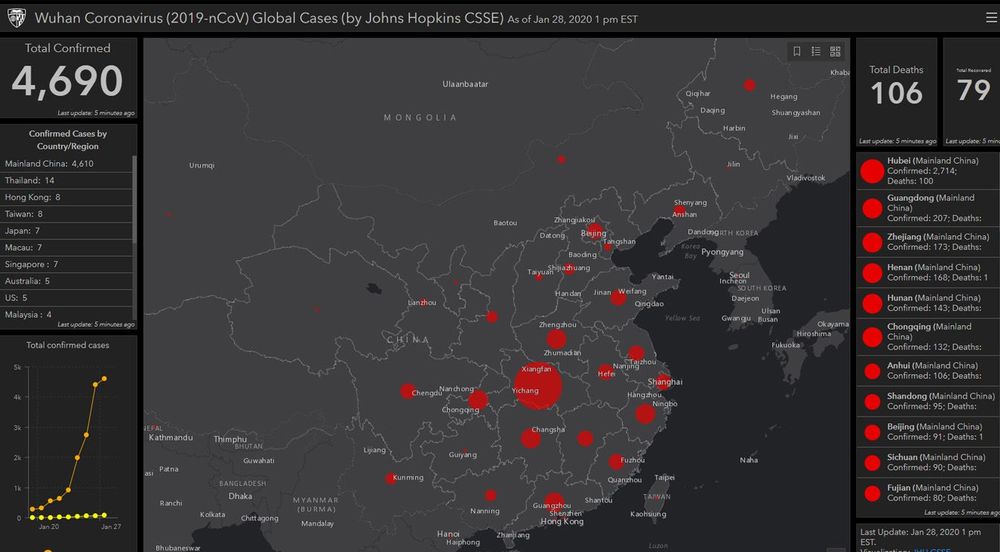
You’d have to be living under a very isolated rock to be unaware of the dangerous coronavirus outbreak centered on the city of Wuhan in China. The disease has infected several thousand people, and more than 100 have died. Researchers at Johns Hopkins University have created a new tool to track and visualize the outbreak. In a world where it’s easy to spread incorrect information, having an authoritative and easily digestible source like this can be essential.
China allegedly sought to keep the epidemic under wraps, arresting people who posted about the virus on social media. However, the rapid spread of coronavirus infections soon made it impossible to hide. The Chinese government eventually sealed the city of Wuhan as it tries to get a handle on the situation, but many people left the city before that happened. Surrounding provinces have confirmed several dozen infections, and there are a handful of cases in other countries like Thailand, Japan, and the US.
Coronaviruses are a common cause of respiratory infections in humans — it’s one of the pathogens that can cause the “common cold.” However, some strains can be much more dangerous. For example, the 2003 SARS outbreak was a strain of coronavirus called SARS-CoV. The new strain doesn’t have a fancy acronym. It’s just known as the Novel coronavirus (2019-nCoV). Out of over 4,000 infections, 106 have died and only 79 have completely recovered.
